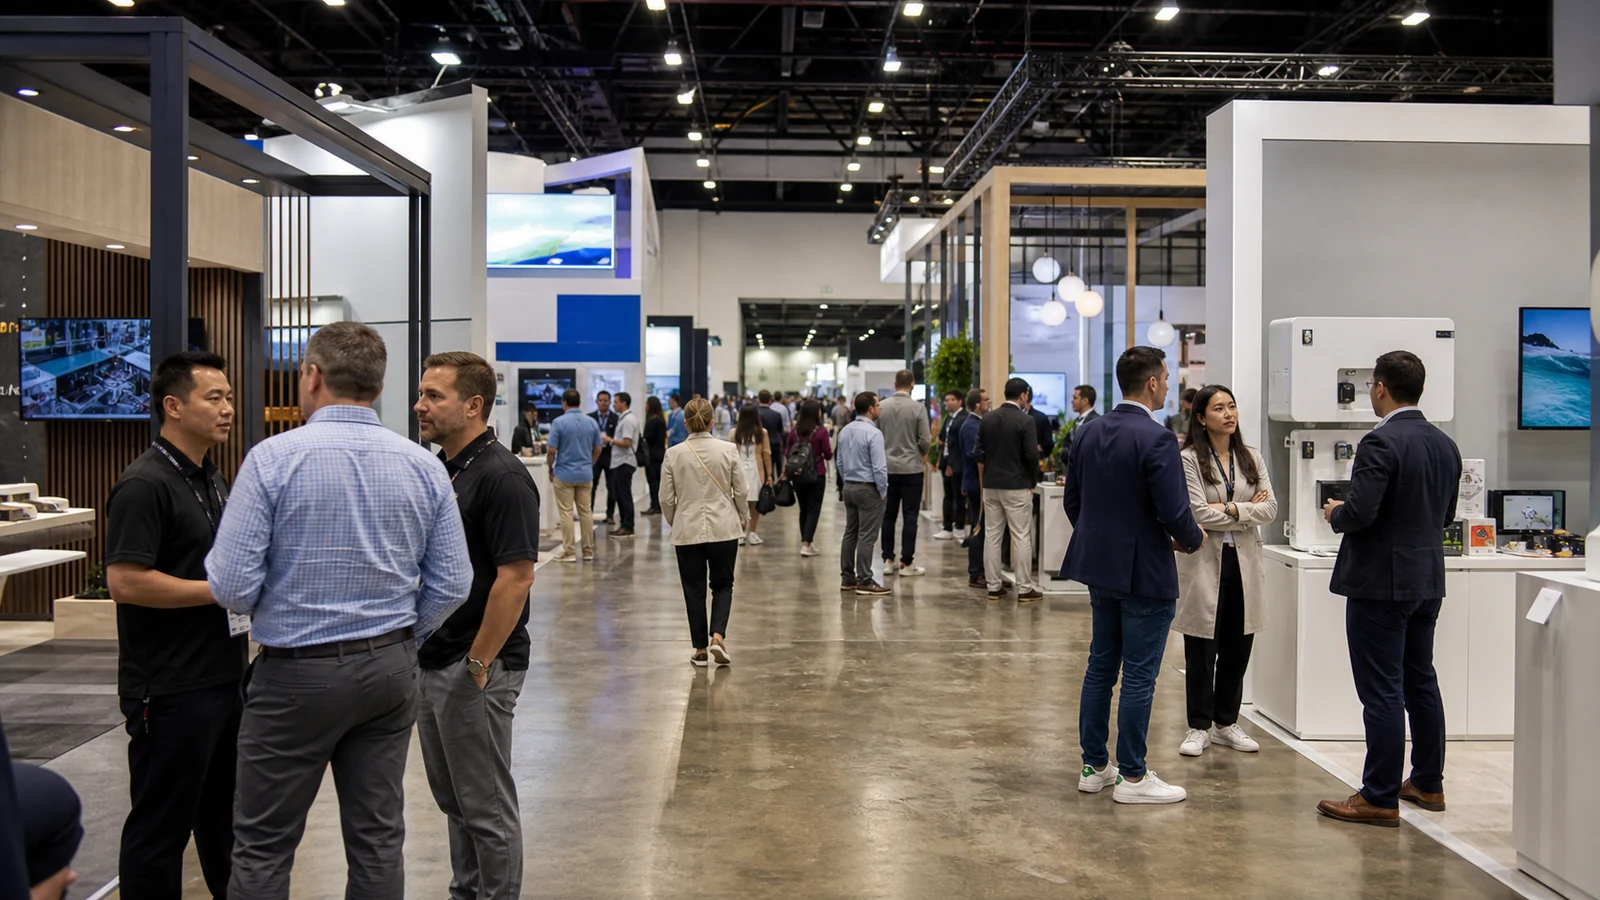
Trade show ROI becomes useful when you can trace a financial result to one event and compare it with every cost required to produce that result. B2B sales cycles, shared accounts, reusable booth assets, and incomplete follow-up records often complicate that calculation. This guide gives you a consistent method for defining, measuring, and using the result.
Quick Answer: How Do You Measure Trade Show ROI?
Measure trade show ROI by subtracting the event's total cost from the gross profit attributable to the event, dividing the result by total cost, and multiplying by 100:
Trade Show ROI (%) = (Attributed Gross Profit - Total Trade Show Cost) ÷ Total Trade Show Cost × 100
Before the show, record three rules at the top of your measurement sheet:
- Return basis: gross profit, revenue, or another finance-approved measure
- Attribution rule: what qualifies as show-sourced or show-influenced business
- Measurement window: when activity, pipeline, and final ROI will be reviewed
Gross profit usually gives you a more decision-useful result than headline revenue because it accounts for the cost of delivering what you sold. If your company uses revenue, label the result as a revenue-based calculation. Do not present a revenue-to-cost ratio or payback ratio as ROI.

What Trade Show ROI Measures—and What It Does Not
Trade show ROI measures net attributable financial return relative to the full event investment. It does not turn booth traffic, badge scans, open pipeline, meetings, or brand awareness into realized return.
| Measure | What it answers | How to report it |
|---|---|---|
| Financial ROI | Did attributable gross profit exceed the full event cost? | Final percentage based on realized results |
| Revenue-to-cost ratio | How much attributed revenue was generated per dollar spent? | Ratio, clearly labeled as revenue-based |
| Payback ratio | How much cost was recovered by the chosen return measure? | Ratio or percentage, not called ROI |
| Return on Objectives (ROO) | Were non-financial goals such as target-account meetings or demos achieved? | Separate scorecard with defined targets |
ROI vs. Revenue-to-Cost Ratio
This ratio divides attributed revenue by event cost. It does not subtract the investment or account for the margin retained after delivery costs, so it answers a different question from ROI.
ROI vs. Payback Ratio
A payback ratio compares return with cost but does not express the net gain after subtracting the investment. Industry measurement guidance therefore distinguishes it from ROI.
ROI vs. Return on Objectives (ROO)
ROO tracks outcomes that cannot yet be valued credibly in money, such as named-account meetings, demos, channel conversations, or product feedback. Report them beside financial ROI rather than adding an invented dollar value to the numerator.
Set Your Measurement Rules Before the Show
Define success before you can design the booth, staffing plan, lead form, and follow-up workflow around it. Post-show definitions make the calculation difficult to audit.
Choose One Primary Business Outcome
Choose the main commercial result: new qualified opportunities, existing-account expansion, channel development, demos that advance active deals, or another specific outcome. Secondary objectives are fine, but one primary outcome keeps your budget and reporting focused.
Define a Qualified Lead and the Next Sales Step
A badge scan is only a contact. Define the need, application fit, decision involvement, timing, and agreed next step required for a qualified lead. Make the next step specific—a technical call, sample review, quotation discussion, site assessment, or meeting with additional stakeholders.
Set Sourced, Influenced, and Existing-Account Rules
Decide when the event receives credit:
- Show-sourced: the event created the first qualified interaction that led to the opportunity.
- Show-influenced: a documented event interaction materially advanced an existing opportunity.
- Existing-account expansion: the event led to a new project, product line, location, or contracted scope.
Keep these categories separate. If the main ROI includes more than one, disclose the scope and count each deal once.
Choose Activity, Pipeline, and Actual ROI Checkpoints
Use early reviews for meetings, qualified leads, and follow-up; use later reviews for opportunities and weighted pipeline. A practical first actual-ROI review date is:
Initial Actual-ROI Review Date = Show End Date + Your Median Lead-to-Close Duration
This is a starting point, not an automatic final closeout. Leads may qualify after the show, the median does not cover longer-tail deals, and large or complex opportunities may mature later. At each review, separate realized gross profit, lost opportunities, and still-open pipeline.
Close the event cohort only under a documented company rule that reflects your product, deal size, and sales-cycle distribution. You might use a later historical percentile, wait until material opportunities are resolved, or apply a finance-approved cutoff. Disclose any open opportunities that remain after closeout.
Build the Full Trade Show Cost Base
An incomplete denominator overstates ROI. Start with a budget, then replace estimates with invoices, payroll allocations, and approved actuals.
| Cost category | Include | Control question |
|---|---|---|
| Space and organizer fees | Exhibit space, registration, sponsorship, required fees | Did you capture every organizer charge? |
| Booth scope | Design, rental or fabrication, graphics, AV, furniture, flooring, storage | Which items are single-use or reusable? |
| Logistics and show services | Freight, drayage, electrical, internet, rigging, cleaning, installation and dismantling | Were estimates replaced with final invoices? |
| People | Travel, lodging, meals, temporary labor, allocated staff time | Is internal time treated consistently? |
| Demand and data capture | Pre-show outreach, campaigns, capture tools, scanners, hospitality | Would this cost exist without the show? |
| Follow-up | Samples, campaigns, travel, demos, and sales time attributable to show leads | Are conversion costs included? |
Space, Sponsorship, and Organizer Fees
Separate exhibit space, sponsorships, and organizer services so you can evaluate upgrades instead of hiding them inside one total.
Booth Design, Rental or Build, Graphics, AV, and Furniture
Capture the full booth scope, including revisions and late changes. Separate rental, reusable, and single-use items.
Freight, Drayage, Show Services, Installation, and Dismantling
Keep estimated and actual columns. Close the ledger only after final material-handling, labor, electrical, and other service invoices arrive.
Travel, Lodging, Staff Time, Marketing, Lead Capture, and Follow-Up
Use one company rule for staff time and include the marketing and sales work required to convert show conversations. Apply the same rule across events.
How to Allocate a Purchased or Reusable Booth Across Shows
Use a documented allocation method, such as expected uses or an approved depreciation schedule. Add show-specific refurbishment, graphics, storage, freight, and labor separately.

Attribute Revenue, Gross Profit, and Pipeline Correctly
Start with reproducible deal records, not a general impression that the show “helped.”
| Return category | Use in actual ROI? | Required evidence |
|---|---|---|
| Show-sourced closed-won business | Yes, under your stated scope | Event source, opportunity, close date, attributable gross profit |
| Show-influenced closed-won business | Only if your rule permits it; preferably separate | Existing opportunity plus documented interaction and advancement |
| Existing-account expansion | Yes if it meets the rule | New scope linked to the event interaction |
| Open pipeline | No | Report only as a projected value with probability and margin assumptions |
| Traffic, scans, or meetings | No | Use as activity or funnel indicators |
Show-Sourced Revenue
Preserve the event source as a contact becomes an account, opportunity, quote, and closed-won deal. Otherwise, final attribution will depend on memory.
Show-Influenced Revenue
Define what material advancement means. Record a new stakeholder, resolved concern, confirmed specification, or agreed next step; a casual visit from an account near signature is not enough.
Existing-Customer Expansion and Retention
Expansion is measurable when the interaction leads to identifiable new gross profit. Do not assign an entire renewal to the show without clear causal evidence and a finance-approved method.
Gross Profit Instead of Headline Revenue
Use attributed gross profit when available because equal-revenue deals can retain different margins. If you only have revenue, label the calculation accordingly.
Rules That Prevent Double Counting
Give each deal one treatment in the main calculation. As a forecast becomes an actual result, replace it rather than adding both values.
Calculate Actual Trade Show ROI
Once final costs and realized returns are available, the calculation is straightforward. The quality of the result depends on the records behind each input.
The Actual ROI Formula
Trade Show ROI (%) = (Attributed Gross Profit - Total Trade Show Cost) ÷ Total Trade Show Cost × 100
Keep the cost ledger, included deal IDs, gross-profit source, attribution scope, measurement date, and calculation version with the result. Someone outside the event team should be able to reproduce it.
A Worked B2B Example
Assume one show has a total cost of $60,000 and produces $90,000 in attributed gross profit within the approved measurement window:
($90,000 - $60,000) ÷ $60,000 × 100 = 50% ROI
The show generated $30,000 in net return above its cost. This is a mathematical example, not an industry benchmark or a KingExhibits client result.
How to Read 0%, 50%, and 100% ROI
- 0% ROI: attributed gross profit exactly covered the full show cost.
- 50% ROI: after recovering the full cost, the show produced net return equal to 50% of that cost.
- 100% ROI: after recovering the full cost, the show produced an additional amount equal to the full cost.
A positive percentage does not automatically make a show your best use of budget. Compare it with your required return, other acquisition channels, sales capacity, strategic objectives, and risk.
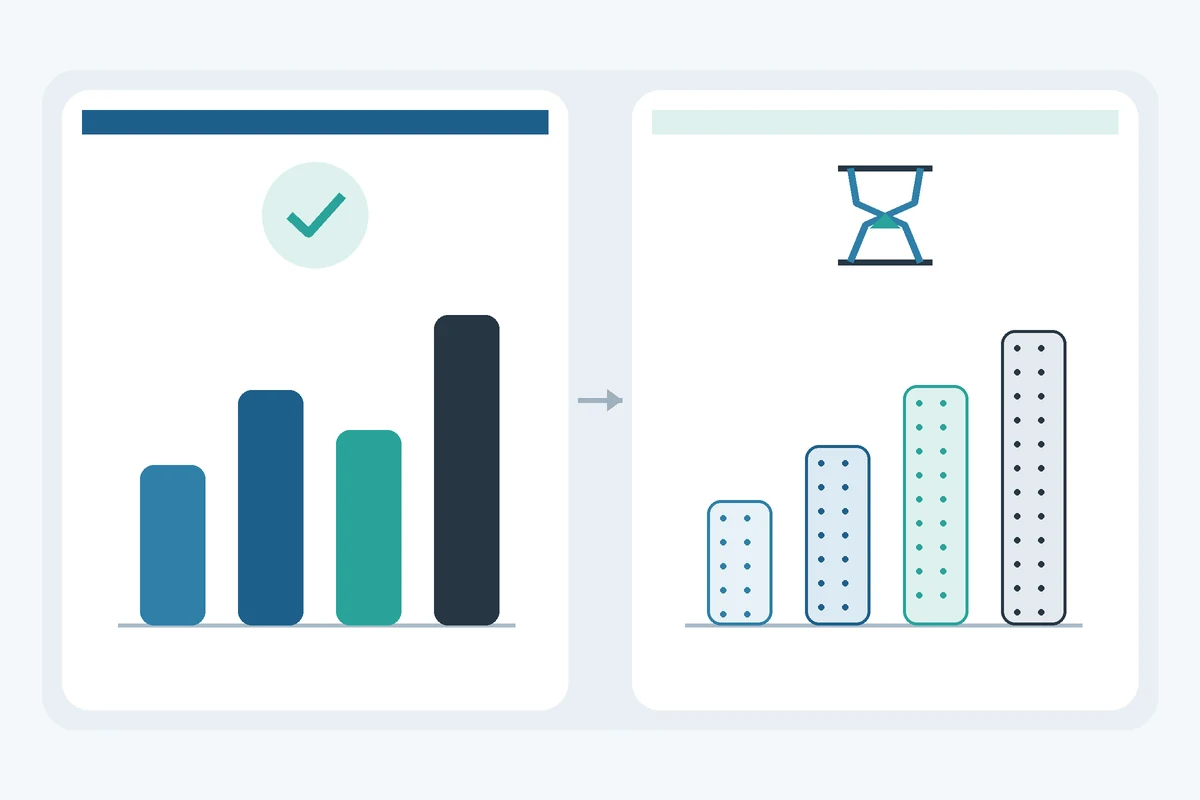
Estimate ROI Before B2B Deals Close
For long sales cycles, report projected ROI separately using your own historical conversion and margin data.
Qualified-Lead Model
Expected Gross Profit = Qualified Opportunities × Historical Win Rate × Average Gross Profit per Won Deal
Use qualified opportunities, not raw contacts. The win rate and average gross profit must begin at the same funnel stage and come from a relevant period.
Weighted-Pipeline Model
Multiply each opportunity's expected gross profit by a consistent stage probability, then total the weighted amounts. Keep show-sourced and show-influenced pipeline separate.
Projected ROI Formula
Projected ROI (%) = (Expected Gross Profit - Total Trade Show Cost) ÷ Total Trade Show Cost × 100
State the model date, included opportunities, win-rate source, margin assumption, and cost status.
Replace Forecasts With Actuals Over Time
When an opportunity closes, replace its weighted amount with actual attributable gross profit or remove it if lost. This keeps the forecast and actual report aligned.
Track the Funnel Metrics That Explain the ROI Number
ROI is an outcome metric. Funnel metrics show whether the weakness was event fit, booth engagement, qualification, sales handoff, or closing performance.
| Metric | Formula | Data source | What it helps you diagnose |
|---|---|---|---|
| Qualified lead rate | Qualified leads ÷ captured contacts | Lead form and qualification record | Whether traffic matched your commercial criteria |
| Cost per qualified lead | Total show cost ÷ qualified leads | Cost ledger and CRM | The acquisition cost of usable conversations |
| Meeting-to-opportunity conversion | Opportunities created ÷ qualified meetings | Calendar/lead records and CRM | Whether meetings advanced into real sales work |
| Opportunity win rate | Closed-won opportunities ÷ mature opportunities | CRM | Whether sourced opportunities convert |
| Median sales cycle | Median days from qualified start to close | CRM | When the first actual-ROI review becomes useful |
| Gross profit per show day | Attributed gross profit ÷ show days | Finance and event record | Return relative to time on the show floor |
Qualified Lead Rate
A high contact count with a low qualified-lead rate may indicate weak event fit, unclear booth messaging, poor targeting, or inconsistent qualification. Review the reasons contacts were rejected before changing the booth size.
Cost per Qualified Lead
This metric makes cost and quality visible together. Compare it only when you use the same cost scope and qualified-lead definition across events.
Meeting-to-Opportunity Conversion
Meetings are valuable when they create a defined commercial next step. A low conversion rate can point to the wrong attendees, a weak discovery process, or a handoff that loses context.
Opportunity Win Rate and Sales Cycle
Win rate tests lead quality over time; sales-cycle duration helps you schedule reviews. Use the separate closeout rule for longer-tail deals, and segment show-sourced opportunities if they behave differently from your normal pipeline.
Pipeline and Gross Profit per Show Day
Per-day measures help compare events of different lengths, but they do not replace ROI. Use pipeline per day as a forecast indicator and realized gross profit per day as a retrospective efficiency measure.
Connect Booth Activity to CRM and Sales Follow-Up
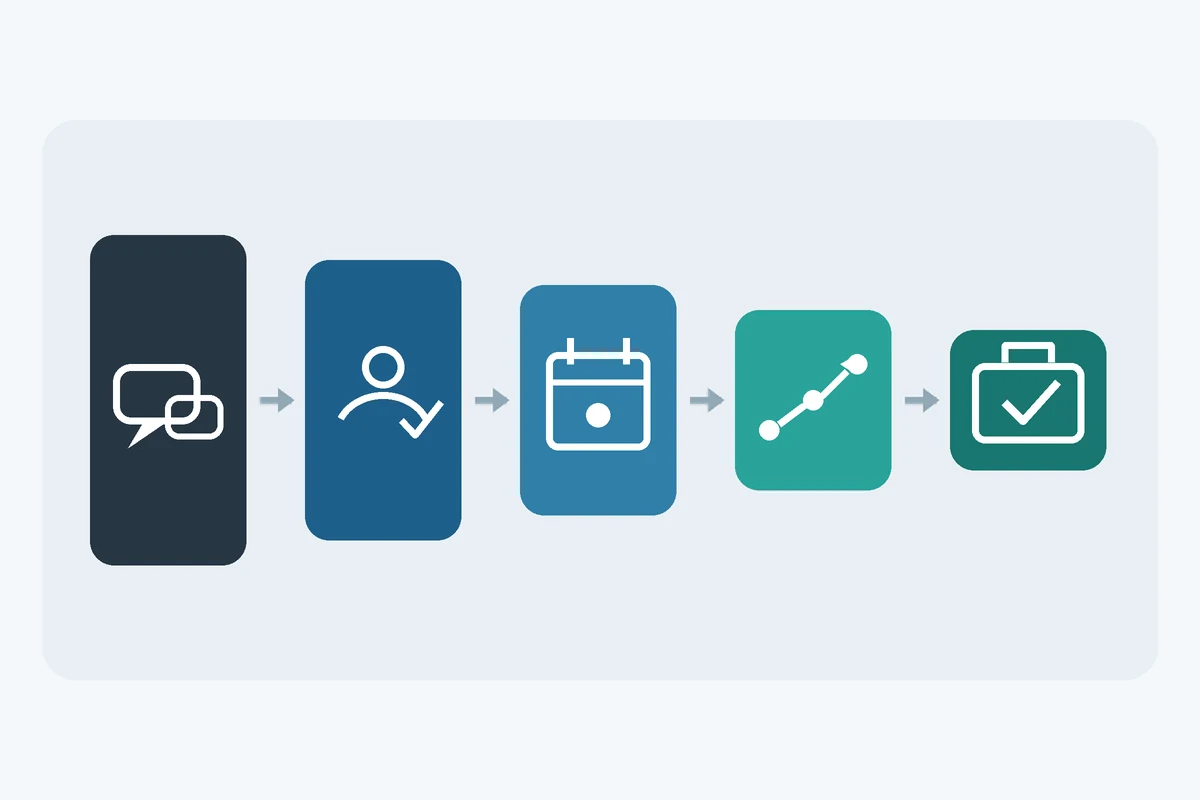
The measurement chain can break even when the booth performs well. If the event source, qualification details, owner, and next step do not survive the handoff, you cannot connect the conversation to future revenue.
Create the Event Source Before Lead Capture Starts
Create one unique event source and test it before the show. Apply it to scanner imports, forms, scheduled meetings, and manually entered contacts. Use campaign tags for event emails or landing pages when relevant, but preserve one reportable source for the opportunity.
Record Product Interest, Role, Timing, and Agreed Next Step
Capture only fields your sales team will use, but make the critical ones mandatory: product or application interest, the contact's role in the decision, business timing, qualification notes, and the agreed next step. Free-form notes alone are difficult to compare at scale.
Your booth brief should identify where product demonstrations, focused conversations, scheduled meetings, and lead capture will happen. A layout that supports those interactions makes the operating plan easier to execute; it does not replace the data process.
Assign Follow-Up Ownership and Preserve the Source Field
Every qualified record needs an owner and due date. Decide before the show how records are routed by territory, product, account, or opportunity type. Lock or map the original event source so it is not overwritten by a later campaign.
Track Meetings, Opportunities, and Closed-Won Deals
A practical chain is:
Unique Event Source → Qualified Interaction → Assigned Next Step → Opportunity → Closed-Won Deal → Attributed Gross Profit
Review exceptions at each transition. Records with no owner, no next step, duplicate accounts, missing source, or stalled opportunities should be fixed while context is still fresh.

Compare Shows and Turn ROI Into the Next Budget Decision
The purpose of measurement is not merely to defend the past. It is to decide what to repeat, stop, resize, or test next.
Compare Like With Like
Use the same return basis, cost categories, attribution rules, qualification definition, and measurement window. If one show includes staff time and follow-up while another does not, rank-ordering their ROI will mislead you.
Separate Show Fit, Booth Execution, Staffing, and Follow-Up Problems
| Observed result | First diagnosis | Practical next test |
|---|---|---|
| Low qualified traffic | Event audience fit, location, outreach, or message | Validate target-account presence and improve pre-show appointment setting |
| High traffic, few qualified leads | Message, targeting, or qualification | Clarify who the offer is for and tighten discovery questions |
| Qualified meetings, few opportunities | Conversation quality or handoff | Define next steps and transfer complete notes with ownership |
| Strong opportunities, low win rate | Offer, sales process, competition, or follow-up | Review loss reasons and stage progression before changing the booth |
| Queues, missed demos, unavailable meeting space | Capacity or layout constraint | Test a different space allocation, staffing level, or booth footprint |
Change Booth Size or Layout Only When the Data Shows a Capacity Problem
A larger booth can add cost without fixing poor event fit or weak follow-up. Increase or reconfigure space when evidence shows that queues, demonstration bottlenecks, insufficient meeting areas, storage conflicts, or unclear traffic flow prevented valuable interactions.
Document the Next-Test Decision
End the report with one decision, one owner, and one metric. For example: preserve the same footprint, add a second demonstration point, and test whether completed demos per hour increase without reducing qualified meeting quality. A defined test turns the next show into comparable evidence.

Common Trade Show ROI Measurement Mistakes
Use this table as a final control check rather than repeating the full measurement process.
| Mistake | Consequence | Repair action |
|---|---|---|
| Counting badge scans as return | Activity is mistaken for financial value | Qualify contacts and track them to sales outcomes |
| Omitting drayage, staff time, or follow-up | ROI is overstated | Use a standard full-cost ledger |
| Counting 100% of pipeline as revenue | Forecast becomes fictitious realized return | Weight pipeline and label projected ROI |
| Adding projected and actual return | The same deal is counted twice | Replace forecasts as opportunities close |
| Changing measurement windows | Shows cannot be compared fairly | Use documented review and closeout rules |
| Converting awareness into invented revenue | The calculation gains false precision | Report non-sales outcomes as ROO |

Frequently Asked Questions About Trade Show ROI
What Is a Good ROI for a Trade Show?
Under this gross-profit formula, 0% means attributable gross profit covered the full show cost; 100% means it also produced an amount equal to that cost. A good result must clear your company's required return and compare favorably with alternatives. No universal percentage fits different margins, attribution rules, cycles, and cost scopes.
How Long After a Trade Show Should You Calculate Final ROI?
Use your median lead-to-close duration to schedule the first meaningful actual-ROI review, not to declare every deal final. Continue reviewing longer-tail and later-qualified opportunities under a documented closeout rule suited to your product, order size, and sales-cycle distribution. Label earlier reports as activity, pipeline, or projected ROI.
Can Brand Awareness and Other Non-Sales Results Be Included in Trade Show ROI?
Only if your company has a finance-approved, reproducible monetary valuation method. Otherwise, report awareness, research, relationships, and engagement as ROO beside the financial calculation.
Should You Use Revenue, Gross Profit, or Pipeline in the ROI Formula?
Use attributed gross profit for actual ROI when possible. Label a revenue-based calculation clearly. Use open pipeline only for projected ROI after applying relevant probability and margin assumptions.
How Many Qualified Leads Do You Need to Break Even?
Break-Even Qualified Leads = Total Trade Show Cost ÷ (Qualified-Lead-to-Win Rate × Average Gross Profit per Won Deal)
At a $60,000 cost, 20% qualified-lead-to-win rate, and $15,000 average gross profit per win, you need 20 qualified leads. Round up non-whole results and use inputs that begin at the same qualified-lead stage.
Final Thoughts
Credible trade show ROI is not a percentage created after the event. It is a continuous record connecting your objectives, complete costs, booth interactions, qualification data, sales follow-up, opportunity history, and realized gross profit. When those links are intact, the final number helps you make a better budget decision instead of simply justifying a past expense.
For your next show, prepare the event name, booth footprint, product-demonstration needs, meeting goals, budget range, and the interactions you need to capture. KingExhibits can use that brief to plan a booth design, build scope, and project approach aligned with how your team intends to engage and measure the event. Your sales, CRM, and finance processes remain responsible for attribution and final ROI, and no booth plan can guarantee the result.
Sources
- EXHIBITOR: Calculating Value—6 Metrics to Gauge Your Exhibit-Marketing Program — ROI calculation, estimated revenue, closing ratios, and consistent measurement periods.
- EXHIBITOR: How to Measure the Value of Trade Show Marketing — distinction between payback ratio and ROI.
- UFI: Evaluation of Participation — evaluating participation through both quantitative and qualitative outcomes relative to resources used.