Your hands-on product demo stayed busy, and the sales team wants it back at the next show. Before you approve another build, you need to know whether the experience helped buyers move forward enough to justify its cost. A full appointment book is encouraging; it does not tell you how much of that business would have happened anyway.
Experiential marketing ROI (return on investment) compares the cost of an experience with the sales contribution credited to it: the money left after the variable costs of those sales. For your next budget decision, go a step further: estimate what the experience added beyond the booth and sales activity you would have run without it. That distinction can change a decision from “make it bigger” to “test it again at a lower cost.”
Give the experience a job you can follow through to a sale
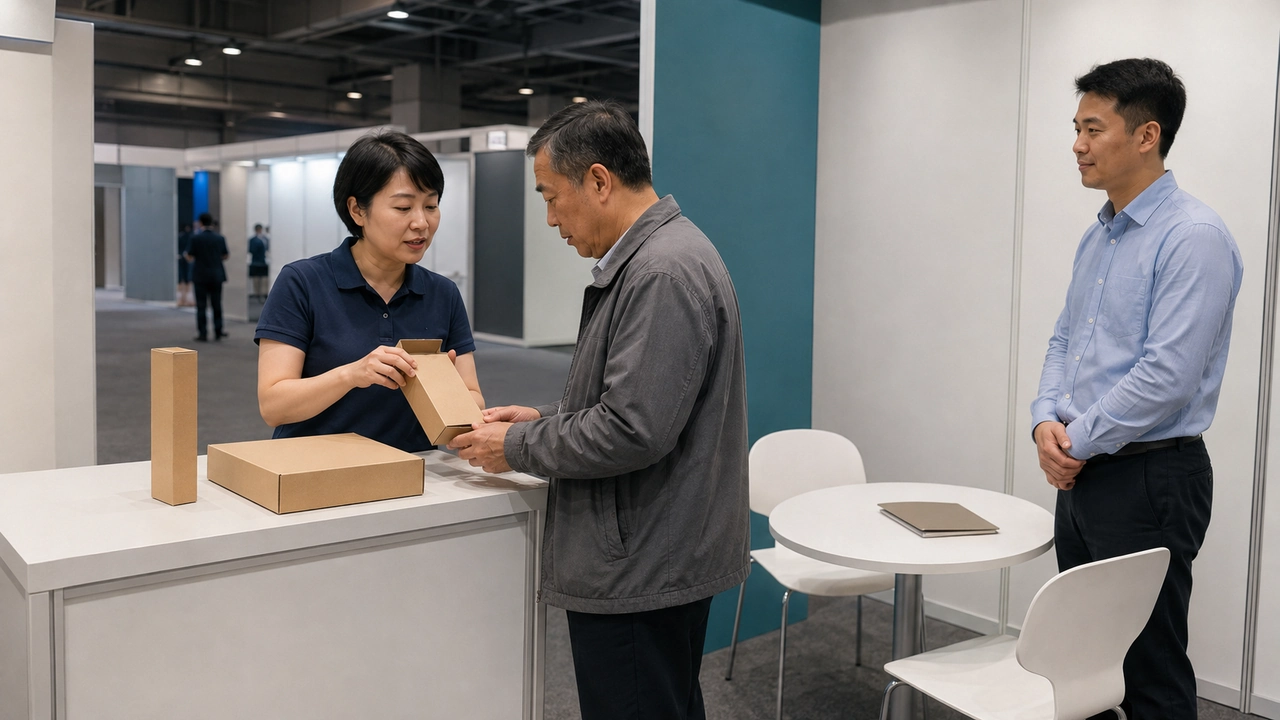
Consider a packaging equipment company that lets visitors try changing between two pack formats. The experience should help a buyer understand whether changeovers would work for their production line. A useful next step might be an application review using their actual packaging specifications.
Write that next step into the demo brief. Staff need a way to finish the interaction, record the buyer’s application, and arrange the review. If the participant leaves with a giveaway but no reason to continue the conversation, a longer dwell time tells you little about the value of the equipment demonstration.
Choose the level at which you will judge success. Several people from one plant may try the equipment, but they may all belong to one purchasing decision. Count individual participation to understand station use; count distinct buying accounts and opportunities when following commercial progress.

Calculate ROI on contribution, with a clear cost boundary
Start with the money left from a sale after the variable costs of supplying it, such as production, delivery, and sales commission where applicable. This is contribution before the activation expense, not the full sales price or the company’s bottom-line profit. AccountingCoach’s explanation of contribution margin sets out the distinction between revenue and the amount available after variable expenses.
For this article, the calculation is:
Activation ROI (%) = (Contribution credited to the activation − Activation cost) ÷ Activation cost × 100
Label the result according to the evidence. An attribution rule produces attributed ROI. A credible comparison with what would have happened without the activity can support an estimated incremental ROI. The arithmetic is similar, but the strength of the claim is different.
Ask finance to agree the contribution basis and the expenses included in activation cost. A follow-up expense belongs in one place in the calculation; subtracting it from sales contribution and again from activation cost counts it twice.
The cost boundary depends on what you are deciding:
| Your decision | Costs that belong in the comparison |
|---|---|
| Add the experience to a booth already approved | The extra spending and resources required compared with running the booth without it |
| Launch a standalone experience | The full cost of creating, promoting, running, and measuring that program |
| Compare the performance of experiences across events | A consistent allocation of shared costs, shown separately from the cash needed for the next run |
For an in-booth addition, request more than a price for the interactive station. Check content and programming, rehearsal, extra freight and handling, installation, power or connectivity, operators, consumables, repairs, and follow-up. Use quotes and staff estimates for your design; this is not a standard package of charges that every experience incurs.
Also look at what the station replaces. If it removes a meeting table, the trade-off may be fewer useful sales conversations even when the event budget barely changes. Record that constraint in the decision; do not invent a dollar value for lost meetings. The complete show budget remains a separate review.
Track the demo through to sales
Give the activation its own identifier under the event campaign in your customer relationship management (CRM) system. Record the interaction completed, account, product or application, existing opportunity status, and agreed next action. Keep a record of any existing quote and the opportunity’s stage before the experience. An order already close to signing should not suddenly appear to be a new lead from the demo.
The record should follow the buyer beyond the scan. A QR code can identify a visit to an activation page, but it cannot by itself show that a person completed a useful product trial or caused an order. Test the handoff with the staff who will use it before the show opens.
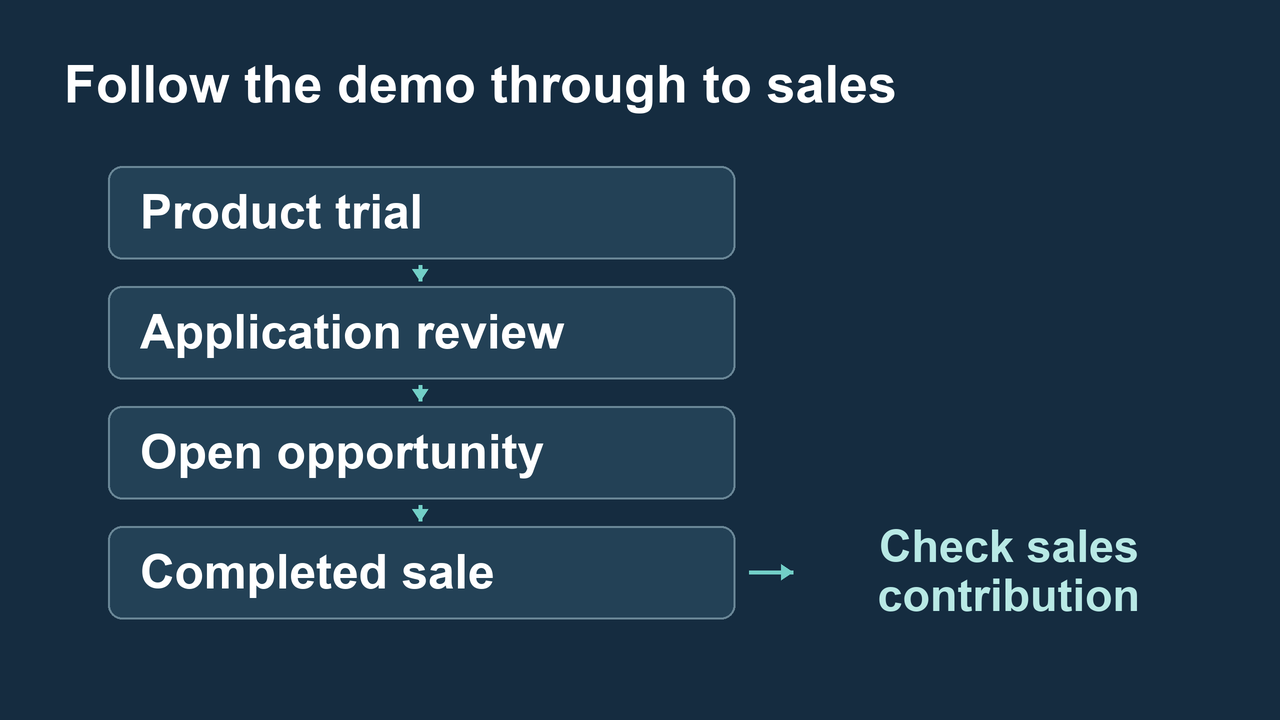
Choose experiential marketing metrics that show where buyers progress or drop out. Read them in sequence; a strong participation count cannot cancel out weak sales progress.
| Evidence | What you can learn | What you still cannot claim |
|---|---|---|
| Target buyers completing the changeover | Whether the activity reached relevant people and worked in practice | That they will buy |
| Application reviews agreed and then held | Whether the interaction progressed into a real technical conversation | That every review was created by the experience |
| Open opportunities linked to those accounts | Which possible sales need follow-up | That pipeline is earned revenue or profit |
| Completed sales and their contribution | How much financial return can be examined under your reporting rules | That all of it was additional business |
Deduplicate opportunities before adding financial values. The show, demo, email campaign, and sales visit may all touch one purchase. Keep those relationships visible, but count the sale once in the company total. If you allocate credit between activities, the shares of that sale must not add up to more than the whole.
Separate assigned credit from business you actually added
Attribution assigns credit for an outcome to the activities involved. Your internal reporting rule might give credit to the first recorded contact, the last one, or several touches. Agree the rule before reviewing the result. A larger percentage assigned to the demo can improve its reported ROI without changing a single customer’s purchase.
Incrementality asks a different question: what changed because you offered the experience? Participants are often already interested, so comparing people who volunteered for the demo with everyone who walked past can overstate its effect.
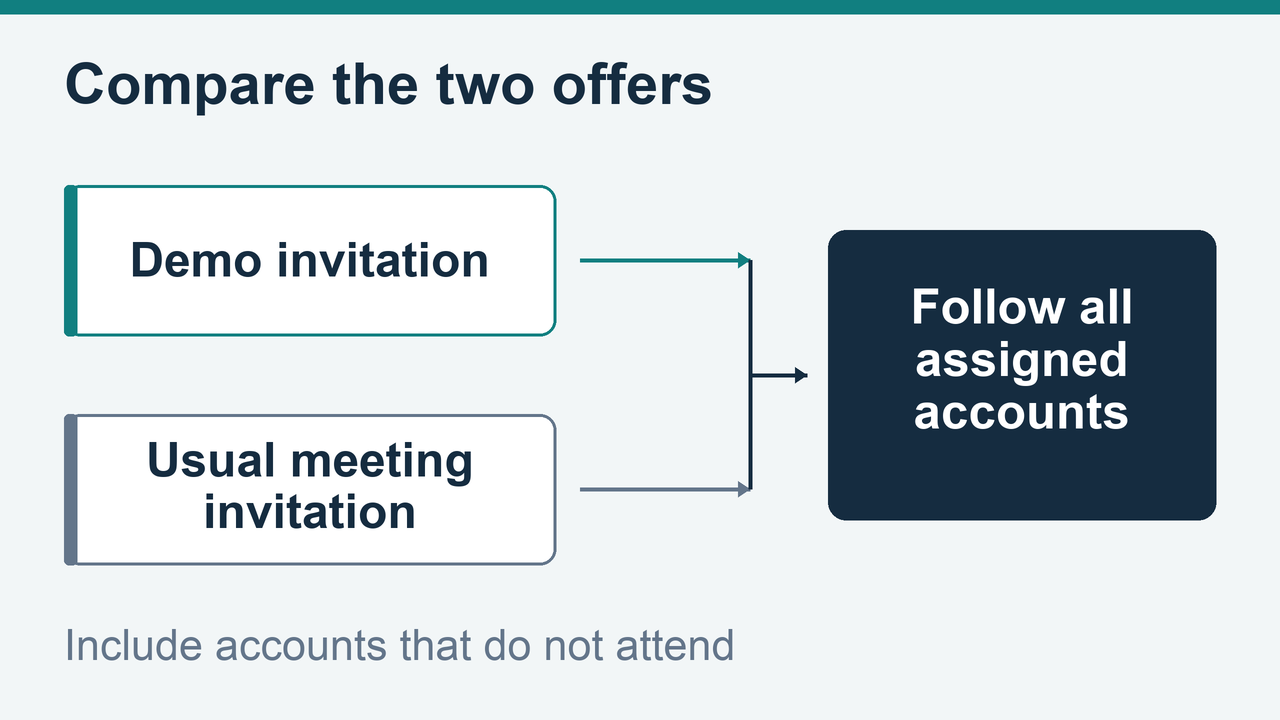
A possible test is to randomly assign eligible buying accounts to an invitation for the hands-on session or to your usual product meeting. Keep colleagues involved in the same purchase in the same group, and keep the other communications and follow-up comparable. Measure results for all accounts in their assigned groups, including those that do not attend. Otherwise, selecting only attendees brings the original interest bias back into the comparison.
This estimates the difference between the two offers, not the isolated effect of touching the equipment. Record any crossover if accounts from the comparison group also use the station. An analyst should check whether the number of accounts, expected orders, and separation between groups can support the decision before you commit to the test.
The principle is similar to the treatment-and-control comparison described in Google’s Conversion Lift documentation. That documentation concerns advertising; the booth test above is an application of the principle, not a claim that Google measures your physical activation.
If a controlled test is impractical, compare similar programs or periods and document what changed: audience, pricing, sales coverage, product availability, and follow-up. Use the result as directional evidence. A before-and-after increase alone does not establish a causal ROI.
A worked example: a busy demo can still only break even
Every figure below is fictional. These are calculation inputs, not King Exhibits results, vendor prices, or an industry benchmark. The example evaluates the extra cost of offering the demo instead of the usual meeting at an already approved show.
| Additional cost | Fictional amount in USD |
|---|---|
| Demo development and equipment adaptation | $10,000 |
| Extra freight, handling, installation, and utilities | $5,000 |
| Specialist staff and rehearsal | $6,000 |
| Data collection and additional follow-up | $3,000 |
| Total activation cost | $24,000 |
Assume 100 eligible accounts are randomly assigned to each offer. All accounts are followed for the same 180-day period, with no meaningful crossover. The period is an example, not a recommended deadline for your sales cycle. Assume each completed order brings $20,000 in revenue and $8,000 in contribution after $12,000 of variable costs. Activation costs are excluded from that $12,000 so they are deducted only once.
| Result at the agreed cutoff | Demo invitation | Usual meeting invitation |
|---|---|---|
| Assigned accounts, including nonattendees | 100 | 100 |
| Completed orders, one per purchasing account | 8 | 5 |
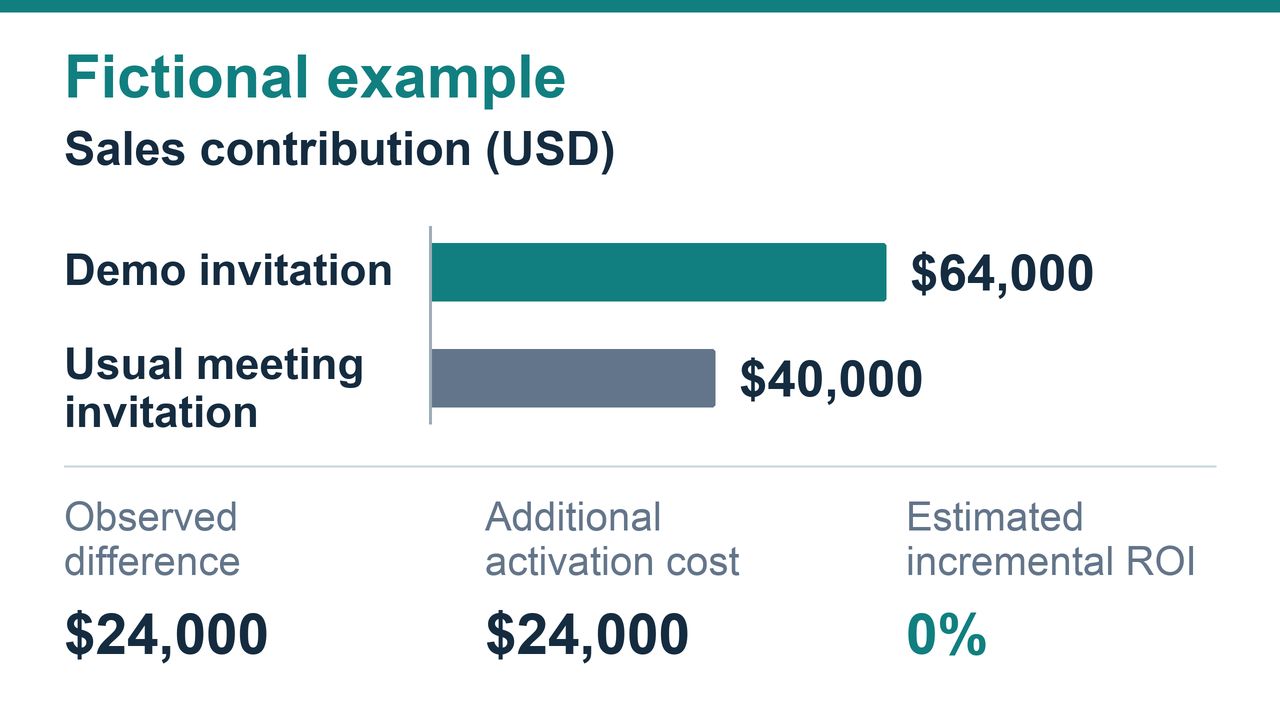
| Contribution from those orders | $64,000 | $40,000 |
The observed difference is 3 orders, or $24,000 in contribution: (8 − 5) × $8,000. With equal group sizes, the example’s estimated incremental ROI is ($24,000 − $24,000) ÷ $24,000 × 100 = 0%.
Crediting all $64,000 from the demo group to the activation would instead suggest a 166.7% return. That calculation ignores the business represented by the comparison group and does not answer whether adding the experience paid off.
The 0% estimate is not proof that the true effect was exactly break-even. Only 13 orders occurred across both groups; the example does not establish statistical significance. A one-order change in the observed difference moves the ROI estimate by about 33.3 percentage points. Ask for an uncertainty assessment before using a small test to justify a large rollout.
The break-even requirement is useful for planning even when the estimate is uncertain: $24,000 ÷ $8,000 = 3 additional orders. Those orders must be additional to the alternative, not simply associated with the demo. If your audience and sales history make that requirement implausible, simplify the experience before paying for it.
Make a provisional decision when sales are still open
Do not force unfinished opportunities into a final return. Set the review window using your own sales history, and show a cutoff date on each report. In the meantime, ask sales to mark each promised application review as held, postponed, declined, or still awaiting a response, and record the reason. Then check which completed reviews produced suitable opportunities. Check that the promised follow-up happened before judging the demo on sales results.
A forecast can use opportunity-specific win probabilities and expected contribution, but label it as projected and show where the probabilities came from. Do not substitute a pipeline face value for profit. When a deal closes, replace its forecast with the actual contribution rather than adding the two. Keep this opportunity forecast separate from estimated incremental ROI: it does not establish which sales the activation added.
If another show must be booked before the result matures, cap the next experiment’s spending and state what it needs to establish. For example, a simpler station might test whether the product trial still produces application reviews without custom animation. That is a testable design decision; buying a larger screen because the first one attracted a crowd is not.
Decide what to repeat, change, or stop
Repeat the experience when the evidence supports enough additional contribution to meet your company’s required return, with room for uncertainty and a realistic cost for the next run. A positive attributed percentage alone does not meet that test. Compare the proposal with a practical alternative, such as more scheduled technical meetings.
Change the part that is preventing progress. If target buyers abandon the queue, first check session length, reset time, and operator availability. If they finish but cannot explain the product’s relevance to their line, improve the task and staff explanation. If application reviews happen but sales stall over price or product fit, a more elaborate booth is unlikely to solve the problem.
Pause when you cannot explain how the interaction helps the buying decision, or when breaking even depends on assigning it nearly every associated sale. Money already spent on a custom build is not a reason to keep paying operators, freight, and show services. The next approval should answer what spending again is likely to achieve.

Frequently asked questions
Can we measure ROI when participants remain anonymous?
You cannot reliably connect individual anonymous interactions to account-level sales without another valid measurement method. Report the participation and feedback you can observe. For the next run, consider an optional application-review booking or a properly designed aggregate study. Do not make staff invent contact records merely to fill a revenue report.
How should we account for an activation reused at several shows?
Keep a record of the original build, refurbishment, storage, shipping, and operating costs. For a program report, allocate shared investment using an agreed basis and revisit it if the number of actual uses changes. For the next-run decision, show the remaining avoidable spending separately. A low allocated cost per show does not explain the cash required to launch the program or prove it has recovered its initial investment.
What if the experience is meant to improve brand awareness?
Set that objective before approving the spend and judge it with a study suited to the target audience. For example, ask whether buyers associate your brand with the specific production problem the demonstration addresses. Keep the question and sampling approach consistent across comparable groups. A measured change in awareness or association is often called brand lift; Google’s explanation describes this kind of perception measurement for video advertising. Awareness or association gains can support a brand decision, but they are not realized profit; do not convert survey responses into dollars using an invented rate.
Can we use an agency’s ROI benchmark to approve the budget?
Ask for the calculation behind it. Check whether the return means revenue, contribution, or a modeled brand value; which costs are included; and how much sales credit the agency assigns to the experience. Also check the audience, sales cycle, and measurement period. An average from consumer sampling cannot tell you how many additional equipment orders your demo will produce. Use a comparable benchmark to challenge your assumptions, not to replace your own break-even calculation.